CableTV.com surveys finds how Americans decide what to watch on TV.
CableTV.com surveyed 1,000 people about how their viewing choices are influenced. Among our findings: YouTube is king, Netflix is easy, and few want to go back to movie theaters.
Table of Contents
Jan 16, 2024 – To quote the Talking Heads song “Once in a Lifetime,” “And you may ask yourself, ‘Why am I watching Bob’s Burgers?” Most people don’t consider why or how they started watching a TV show or movie; it just happened. Or did it?
CableTV.com set out to determine how Americans choose what to watch. We conducted a 1,000-person survey and discovered that outside influences are just as important as personal preferences. Let us look at the numbers.

Why are you watching a particular TV show or movie?
It’s a simple question but, again, not often considered. You just woke up one day and found yourself fully invested in Love Island? Probably not. Here are the ways you may have gotten your toes in the sand.
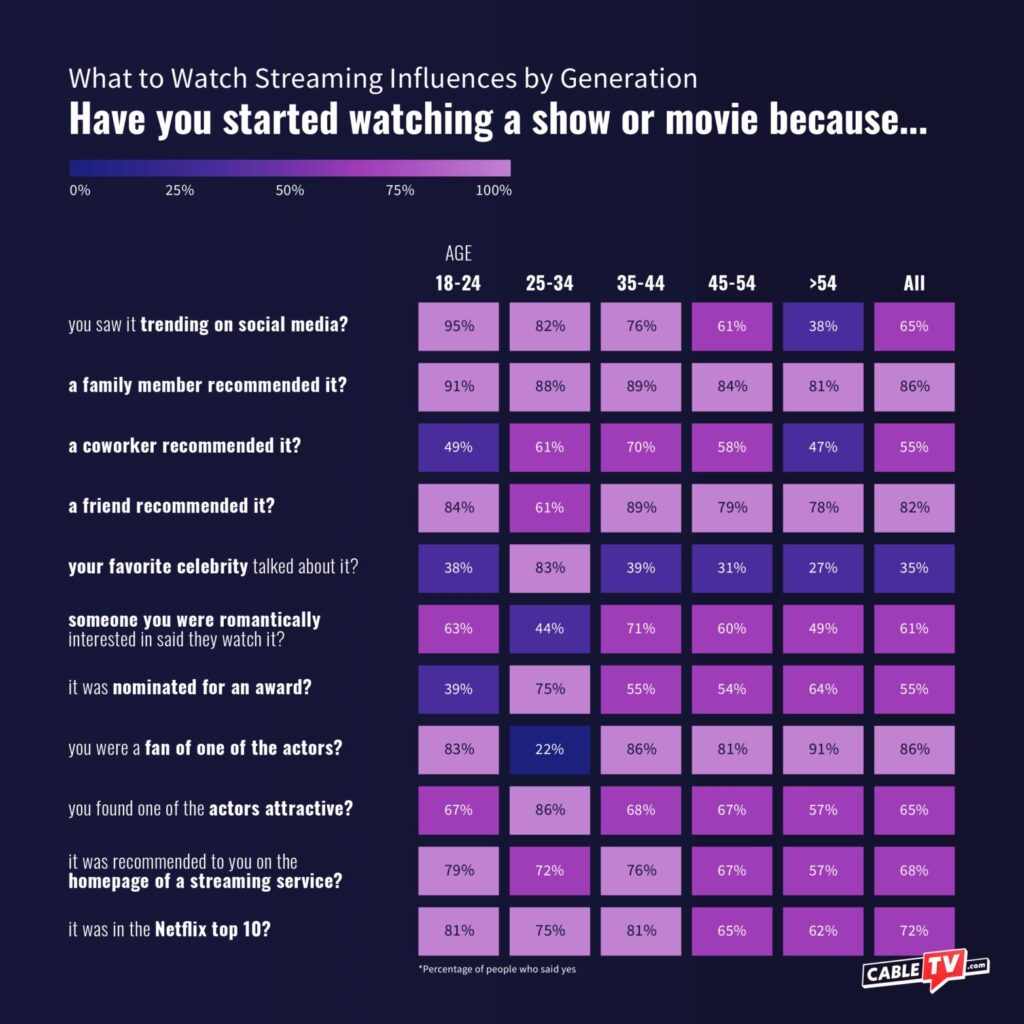
Saw it trending on social media: 95% (18–24)
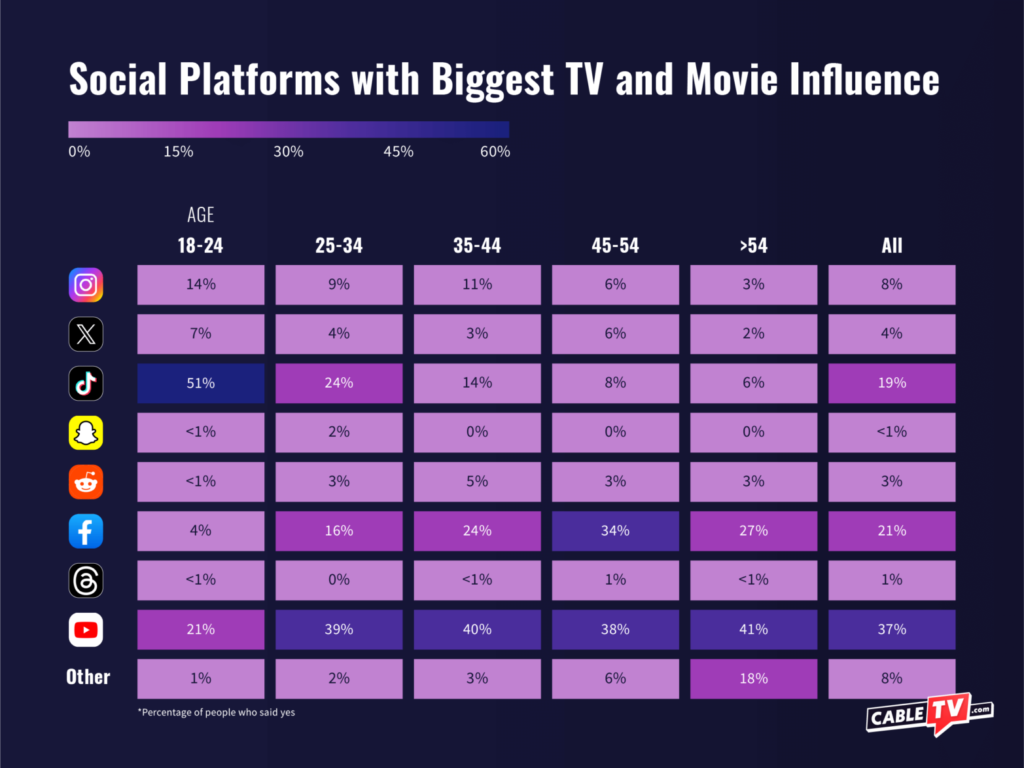
Younger people tend to find out about TV shows and movies through social media—primarily TikTok and YouTube. Conversely, old-school Facebook drives most older viewers aged 35–54 to their new TV faves. (We didn’t inquire about Nextdoor.)
Family member recommended it: 86% (all age groups)
A TV tip from a family member is universal across all generations, more so than from friends (82%) or coworkers (55%—ouch). Have some shows been on forever because of passed-down dad recs? Maybe there’s a Bluey-to-Blue-Bloods generational journey.
Fan of the TV show/movie’s actor: 91% (54+)
An individual actor’s fan base can’t be discounted, regardless of the TV show or movie. How many Emma Stone fans are powering through The Curse and Poor Things just to watch her? On the other hand, the 25–35 demo pays no mind (22%).
Found the TV show/movie’s actors attractive: 86% (25–35)
No matter how much Hollywood talks about “craft” and “integrity,” casting good-looking actors is Job One for TV and movie producers, and Gen Z and Millennials are here for it. Keanu Reeves’ two-expression emoting range is not the key to his success.
Nominated for an award: 55% (all age groups)
An Emmy or an Oscar doesn’t make anything a must-see, despite all the hype around awards shows. So we’re only watching them for the red-carpet glam, not the recognition of superior artistry? This might be the most stunning survey revelation of them all.
How do you decide what to watch?
Influence is one thing; practicality is another. Sometimes what you watch just comes down to how quickly and easily you can find it.
Time spent deciding what to watch: 5–10 mins. (45%)
Considering how many TV shows and movies there are to choose from between streaming services, 45% at 5–10 minutes seems fast and decisive. We’ve all spent what feels like hours scrolling through titles, only to give up and—yikes!—read a book.
Most important factor in viewing decision: Brings me comfort (51%)
Go for the shows you know—the COVID-19 pandemic really brought home how important comfort TV is. Audience reviews (24%) and critic ratings (8%) don’t influence viewing decisions much, but the ability to leave a show on in the background (11%) is why House Hunters even exists.
Easiest streaming service for making viewing decisions: Netflix (47%)
The closest ease-of-use score to Netflix’s 47% is Amazon Prime Video at a mere 16%—looks like Amazon’s obvious attempts at cloning Netflix’s interface for Prime Video have gone unnoticed. Meanwhile, Max’s minuscule 8% score should make Warner Bros. Discovery take notice.
Social media influences every generation differently

More streaming stats from the survey
Streaming services should offer …
- More content: 66%
- Less content: 3%
- Same amount of content: 31%
Do you rotate through streaming subscriptions to avoid content burnout?
- Yes: 54%
- No: 46%
How often do you rotate through streaming subscriptions?
- Monthly: 59%
- Quarterly: 25%
- Yearly: 7%
Do you prefer to stream movies at home or watch them in a theater?
| Location | 18–24 | 25–34 | 35–44 | 45–54 | 55+ | Average |
|---|---|---|---|---|---|---|
| At home | 55% | 54% | 58% | 67% | 65% | 61% |
| In a theater | 10% | 8% | 9% | 7% | 6% | 7% |
| Depends on the movie | 35% | 39% | 33% | 26% | 28% | 32% |
Does deciding what to watch on a streaming service take too long?
| 18–24 | 25–34 | 35–44 | 45–54 | 55+ | Average |
|---|---|---|---|---|---|
| 65% (yes) | 50% (yes) | 42% (yes) | 36% (yes) | 28% (yes) | 41% (yes) |
Does deciding what to watch stress you out?
| 18–24 | 25–34 | 35–44 | 45–54 | 55+ | Average |
|---|---|---|---|---|---|
| 60% (yes) | 38% (yes) | 25% (yes) | 24% (yes) | 12% (yes) | 29% (yes) |
The TV we watch isn’t random
We may think we’re passive TV viewers, but there’s more to what ends up on our screens than we realize. Critic’s recommendations and awards play a small factor, but we mostly rely on family, friends, and our own comfort radar to land on tonight’s binge-watch.
Methodology
CableTV.com’s survey of 1,000 people was conducted using Pollfish in September 2023. Respondents were required to be subscribed to at least one streaming service in order to participate in the survey.

